Which time frame to choose for Intraday trading?

5min candlestick hammer pattern

Beginners in Intraday trading are confused on which time frame to use for intraday trading.

Candlestick patterns play an important role in helping us understand market psychology, Candlesticks provides indication on major reversal and trends.

Intraday traders are always fearful that they will miss an trading opportunity if they do not use particular time frame for trading.

This goal of this article is to make you understand that candlestick patterns are formed in different time frames but the most important aspect of trading is to identify the pattern formation in the time frame which you are trading and become profitable.
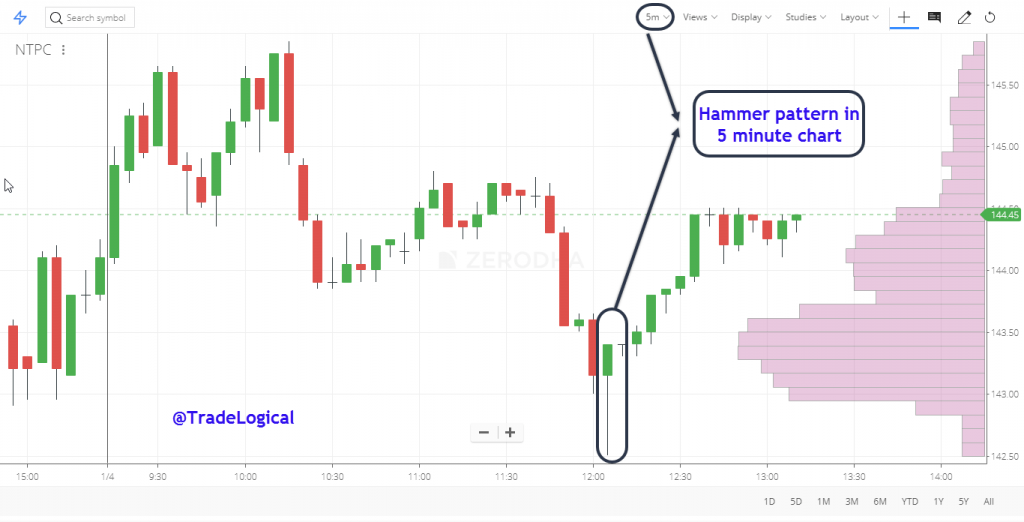
Consider two people doing intraday trading with NTPC stock.

Trader A is using 3 min chart and 

Trader B is using 5 min chart.

Trader A: Identifies Bullish Engulfing Pattern at the bottom of the trend and takes a buy call on this trade (Note: It took total of 6 minutes for the formation of the pattern)

Trader B: Identifies Hammer candlestick pattern at the bottom of trend and takes a buy call on this trade (Note: It took total of 5 minutes for the formation of the pattern)

What did we learn from the above example?

Stop worrying about the time frame to choose for trading and focus on identifying profitable candlestick patterns in the time frame which you are comfortable trading.

So,

Try out your strategies in different time frame and see which time frame you are comfortable trading with and stick to it.

You can always do the multi-time frame analysis for knowing the direction of trend:

For example you can use Hourly chart to identify the direction of the trend and trade in the trends direction using 5 minute chart (do not check for entries in all other time frames)

Learn how to select stocks for Intraday trading using OPEN HIGH LOW SCANNER for free.