Live Open High Low Scanner for intraday 2023[Guide Included]

Open high low scanner is a method used to filter out Open = High or Open = Low scripts for Intraday trading. BUY signal is generated when OPEN = LOW  & SELL signal is generated when OPEN = HIGH

If you see Loading or NA in the scanner below – Please make sure that you are visiting the page between 9:20 am and 3:30 pm.

As we all know F&O stocks have, high volume, I have created the scanner for F&O stocks.

The Entry and Exit details is explained step by step below the scanner.

The scanner below is real time (9:20 AM – 3:30 PM)

  • Here BUY signal is generated when OPEN = LOW
  • and SELL signal is generated when OPEN = HIGH

How to use Open High Low Scanner

Weekly Chart: 

Use weekly chart graph to analyze the longer term trend. Its very important to analyze the “Long term trend”. Trading in the direction of trend will increase your profit drastically.
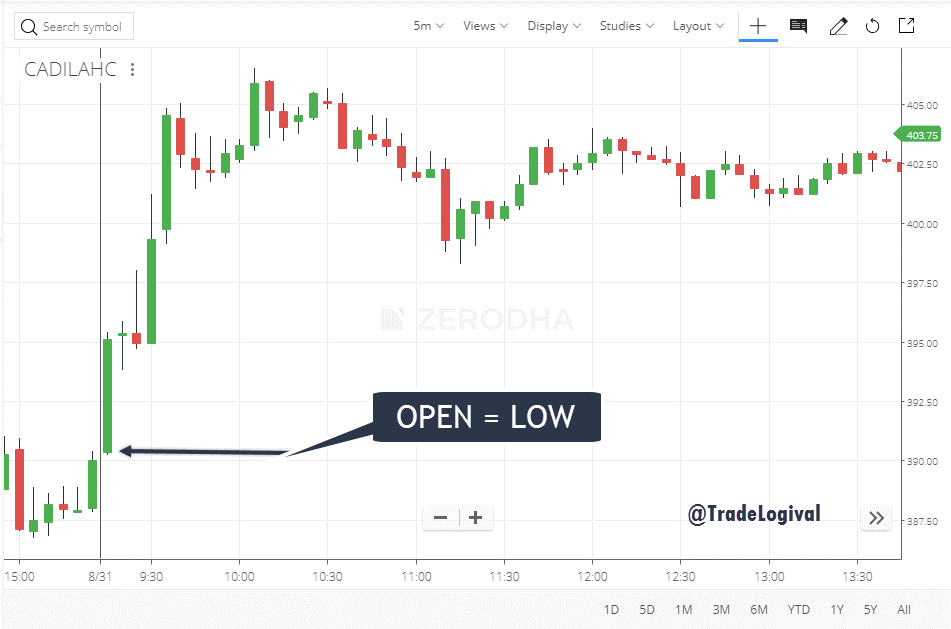
Example

If a stock opens “Open = Low” and the weekly chart is also in upper trend , You can go Long with confidence. In the similar way if “Open = High” and the weekly chart is in downtrend you can go short with confidence.

Volume Filter: 

For Intraday trading choosing high liquid stocks for trading will help you Enter and Exit a trade very easily.

Example: 

When the volume is above 5,00,000 the column turns green, Which indicates there is good liquidity and this will help you easily enter and exit trades.

So, Look out for stocks – 

For Buying >> Open = Low with Weekly uptrend and Volume above 5,00,000
For Selling >> Open = High with Weekly downtrend and Volume above 5,00,000

To be successful in Intraday trading having a tried and tested strategy is very important. 

The open high low strategy is one of the famous strategies which has high accuracy, many people use this strategy on a day to day basis.

Selecting stocks plays a major role in intraday trading, there are various strategies to select stocks for day trading.

You can check various other strategies here – http://tradelogical.com/category/trading-strategies

Why Open High Low Strategy (OHL) is so famous and easy!

  1. You can understand this strategy very easily and implement it in the next trading session!
  2. No need for pre-day analysis, Yes! you save so much of time
  3. Selecting stocks becomes so easy, You just have to know the trend/direction the market is headed

Watch this video for easy understanding –

How does this strategy work?

If today’s open is equal to today’s low ”OPEN=LOW” – Go long.

If today’s open is equal to today’s high ”OPEN=HIGH’ – Go short.

Entry Details

  • Add to watchlist the stocks with Open=Low and Open = High when the market open from the scanner
  • If the Nifty50 index is above 0.25% go on the buy side and if below 0.25% go on the sell side.
  • At 9:30 AM if the low/high is not broken, Buy/Sell stock according to the strategy
  • ”3/5″ minutes candlestick preferred.

Exit Details

Money management is very important. Keep Risk reward ratio 1:2

Stop Loss:

It is preferred to keep SL at the open/close of the previous candle as stop loss,

But the stop loss should never be more than 1% of the stock price. If its more than 1% dont take the trade

Please do paper trading before trying this strategy in the real market.

Don’t lose your hard earned money, Practice until you master one intraday trading strategy and then enter the market.

Watch this video which explains how to use ATR indicator to set Stop Loss

Try this strategy and let us know your opinion/feedback in the comment section below.