Learn to set Stop loss using ATR indicator [Step by step guide]

ATR indicator for stop loss

ATR indicator (Average True Range Indicator) is a volatility indicator. The indicator only provides the degree of price volatility, It does not indicate the direction of the trend.

Price range is necessary to set stop loss, this can be found out by using ATR indicator.

We will learn how to use ATR indicator to set stop loss and trail stop loss.

Why ATR indicator is best for knowing stop loss value

As the name “Average true range” it suggests the average range of stock over the specified periods.

The idea of ranges is that they show the interest of traders. Increasing ranges suggest traders prepared to continue BUY/SELL a stock throughout the day.

Decreasing range suggests decreasing interest.

PRO TIP: During Intraday trading look for stocks which have ATR more than 1, This will help in selecting volatile stocks. 

After selecting a stock for intraday trading, You wait for the perfect pattern formation (Flag pattern or Flat bottom)

Once the pattern is formed before executing the order you think what should be my stop loss!

And you get confused about where to set stop loss.

As every trading book explains, keep the stop loss behind the previous candle or near or just above the pivot points will not work in Intraday trading because:

  • You will not have sufficient time to keep a stop loss below the previous candle (measuring the price at the previous candle during execution is not practical) You will end up missing the price you wanted to enter.

As intraday execution should be fast.

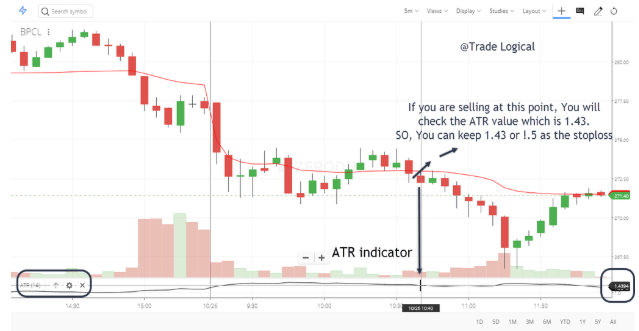
That is why we use ATR indicator for quickly knowing what value to keep for stop loss. 

Formula for Stop Loss using ATR value

For BUY >> “Current price – ATR value = Stop loss”
For SELL >> “Current price + ATR value = Stop loss”

Example on how to use ATR - Explained taking BPCL stock as example e

Let’s understand by analyzing the below image:

  • I have applied VWAP indicator and ATR 14 indicator on the 5 minutes chart
  • You identified the shooting star pattern and ready to sell at the break of VWAP (Added arrow for reference)
  • At the point you are selling note the value the ATR indicator is showing, Here its 1.4
  • This means the stocks average range is 1.4 points considering 14 periods
  • You will use this value as stop loss
  • The stop loss value will be “Price + ATR value = Stop Loss” for SHORTING 

        Hence >>  271.4 + 1.4 = 272.8

  • The Stop loss value will be 272.8

Note: You can round off the ATR value to the nearest multiple of 5 , this will help easy execution as many traders keep similar buy/sell values.

If ATR value is 1.4 you can round off to 1.5

If you feel the stop loss is too near you can multiply the ATR value by 2

Always remember to maintain the risk to reward ratio intact.

Conclusion:

ATR can also be used in the same way for positional trading as well,

The procedure remains the same as explained above.

Let us know in the comment section if you have any doubts.

Must Read: How to use VWAP for Intraday trading and Open High Low Strategy for profitable trading.